
Assistive Technology Market Size & Usage Statistics

Assistive technology (AT) is the umbrella term for the tools people with disabilities rely on to access information and interact with the world, including screen readers, hearing aids, captioning systems, mobility aids, and cognitive support software. For web teams, AT usage data is not an abstract public health topic.
It defines the real conditions under which a meaningful share of visitors experience a website, and it explains why WCAG conformance translates directly into who can and cannot use a product. Among all AT categories, digital and software-based assistive technology is growing the fastest, driven by AI-powered features, mobile adoption, and rising awareness of accessibility as a business requirement rather than a compliance afterthought.

Global Assistive Technology Usage Statistics
Assistive technology is not a niche global issue. It touches a significant share of the world’s population, and that share is growing as life expectancy rises and chronic health conditions become more common.
How Many People Use Assistive Technology
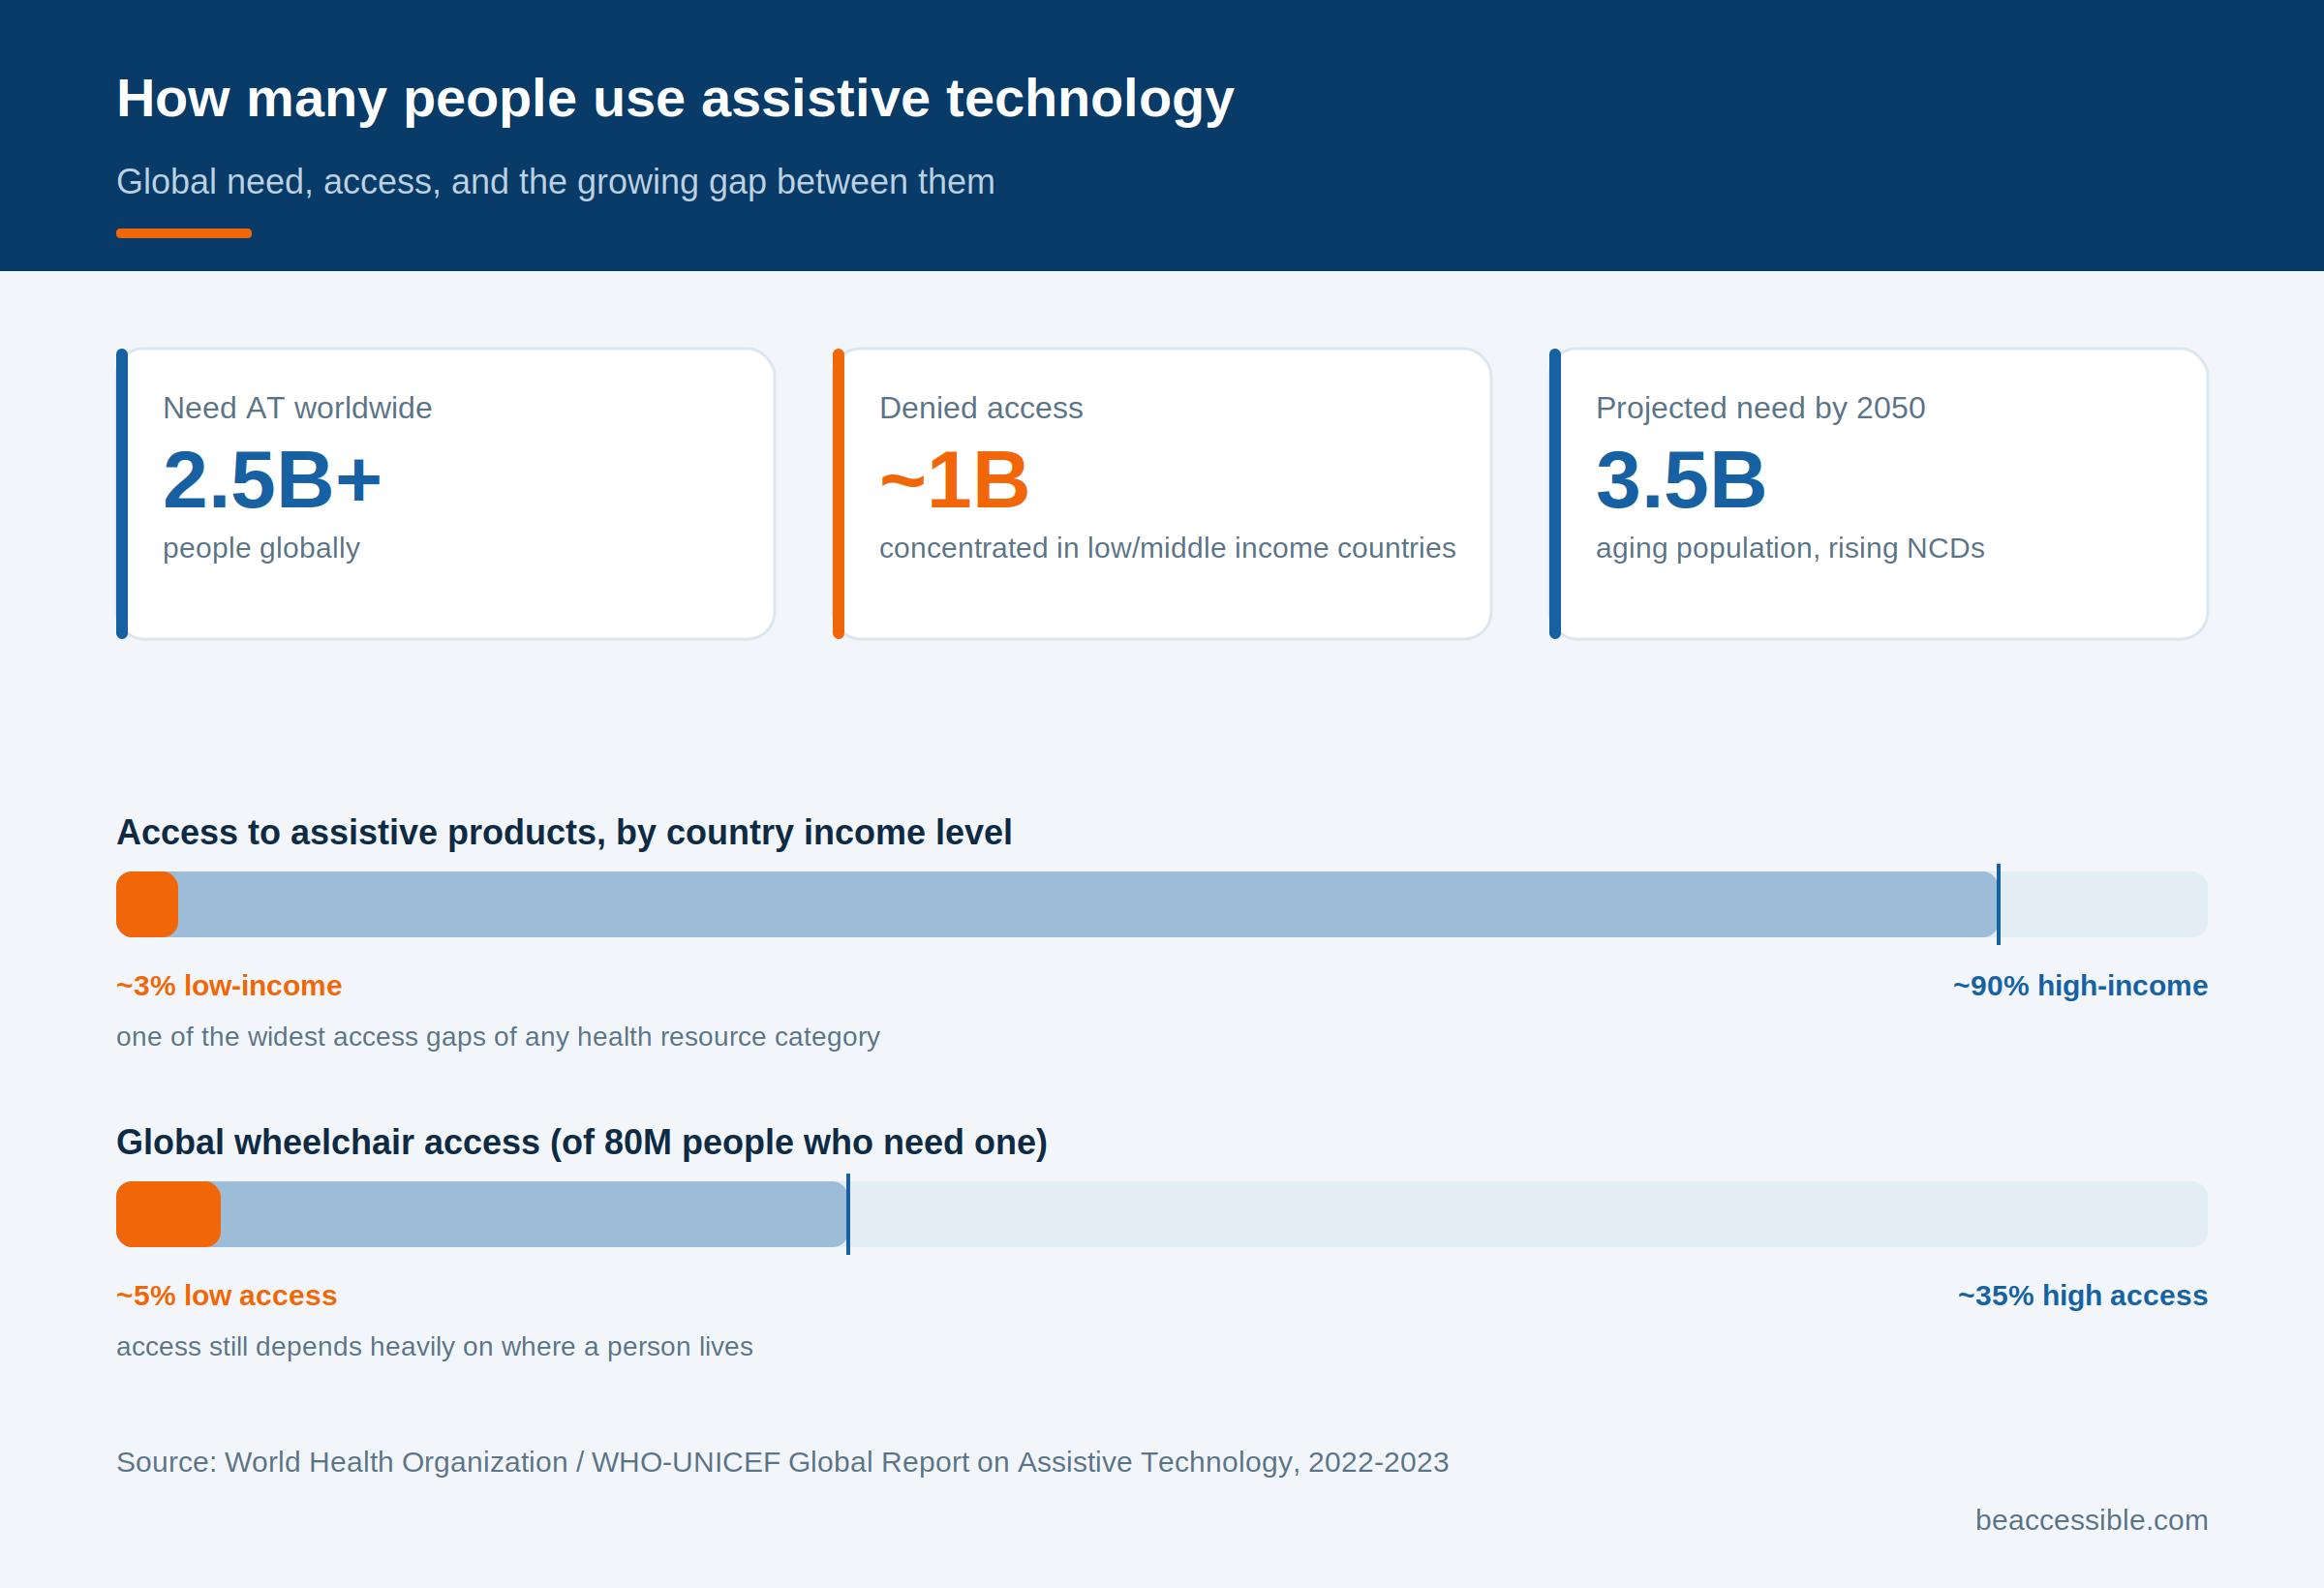
- More than 2.5 billion people globally need one or more assistive products, such as wheelchairs, hearing aids, or software that supports communication and cognition. (World Health Organization, 2023)
- Nearly 1 billion people who need assistive technology are denied access to it, with the gap concentrated in low- and middle-income countries. (WHO-UNICEF Global Report on Assistive Technology, 2022)
- The number of people needing assistive technology is projected to reach 3.5 billion by 2050, driven by an aging global population and rising rates of noncommunicable disease. (World Health Organization, 2023)
- Access to assistive products ranges from 3% in low-income countries to roughly 90% in high-income countries, one of the widest access gaps of any health-related resource category. (World Health Organization, 2023)
- Of the 80 million people globally who need a wheelchair, only 5–35% have access to one, depending on where they live. (World Health Organization, 2023)
AT Usage in the United States
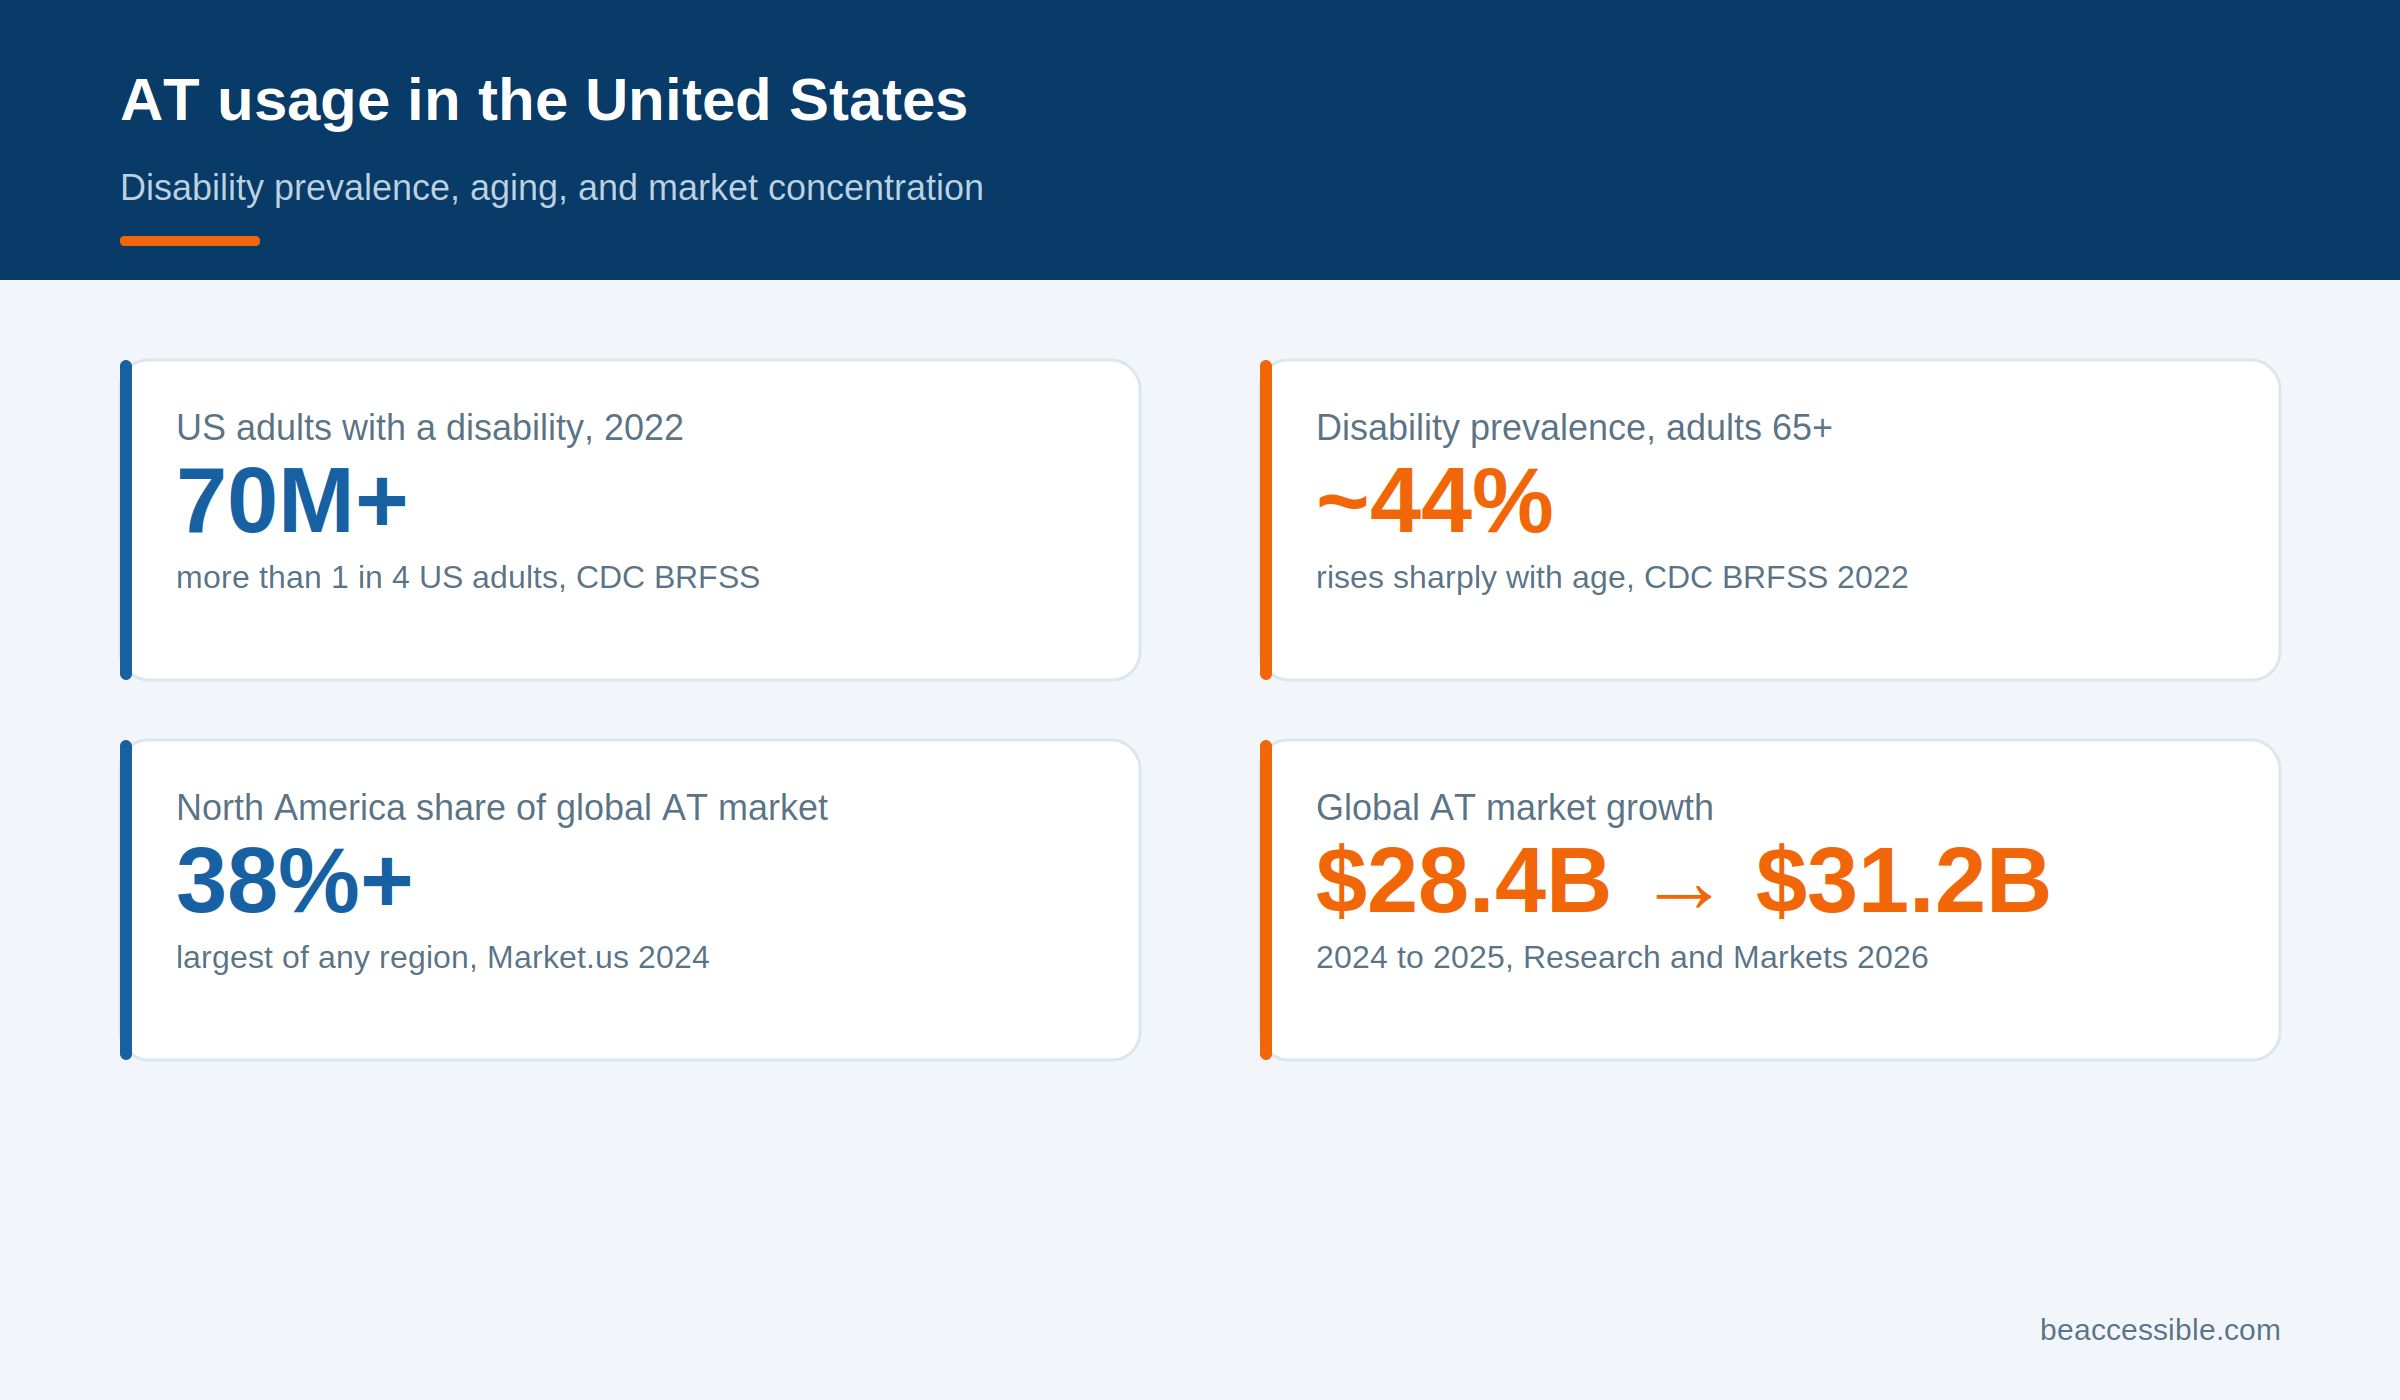
- More than 1 in 4 U.S. adults, over 70 million people, reported having a disability in 2022, representing the population most likely to rely on some form of assistive technology in daily life. (CDC, Behavioral Risk Factor Surveillance System, 2024)
- Disability prevalence nearly doubles with age: 23.6% of U.S. adults 18–44 report a disability, compared to 43.9% of adults 65 and older. (CDC, BRFSS, 2022)
- North America leads the global assistive technology market with $8.7 billion in demand in 2023, more than 38% of the total, driven by an aging population and strong reimbursement infrastructure. (Market.us, Assistive Technology Market Report, 2024)
- Historical U.S. data shows sustained long-term growth in AT reliance: assistive device use among chronically disabled older Americans rose from 72% in 1984 to 90% by 2004, a trend that has continued as digital and software-based AT has expanded the category further. (U.S. Department of Health and Human Services, ASPE)
AT Usage by Disability Type
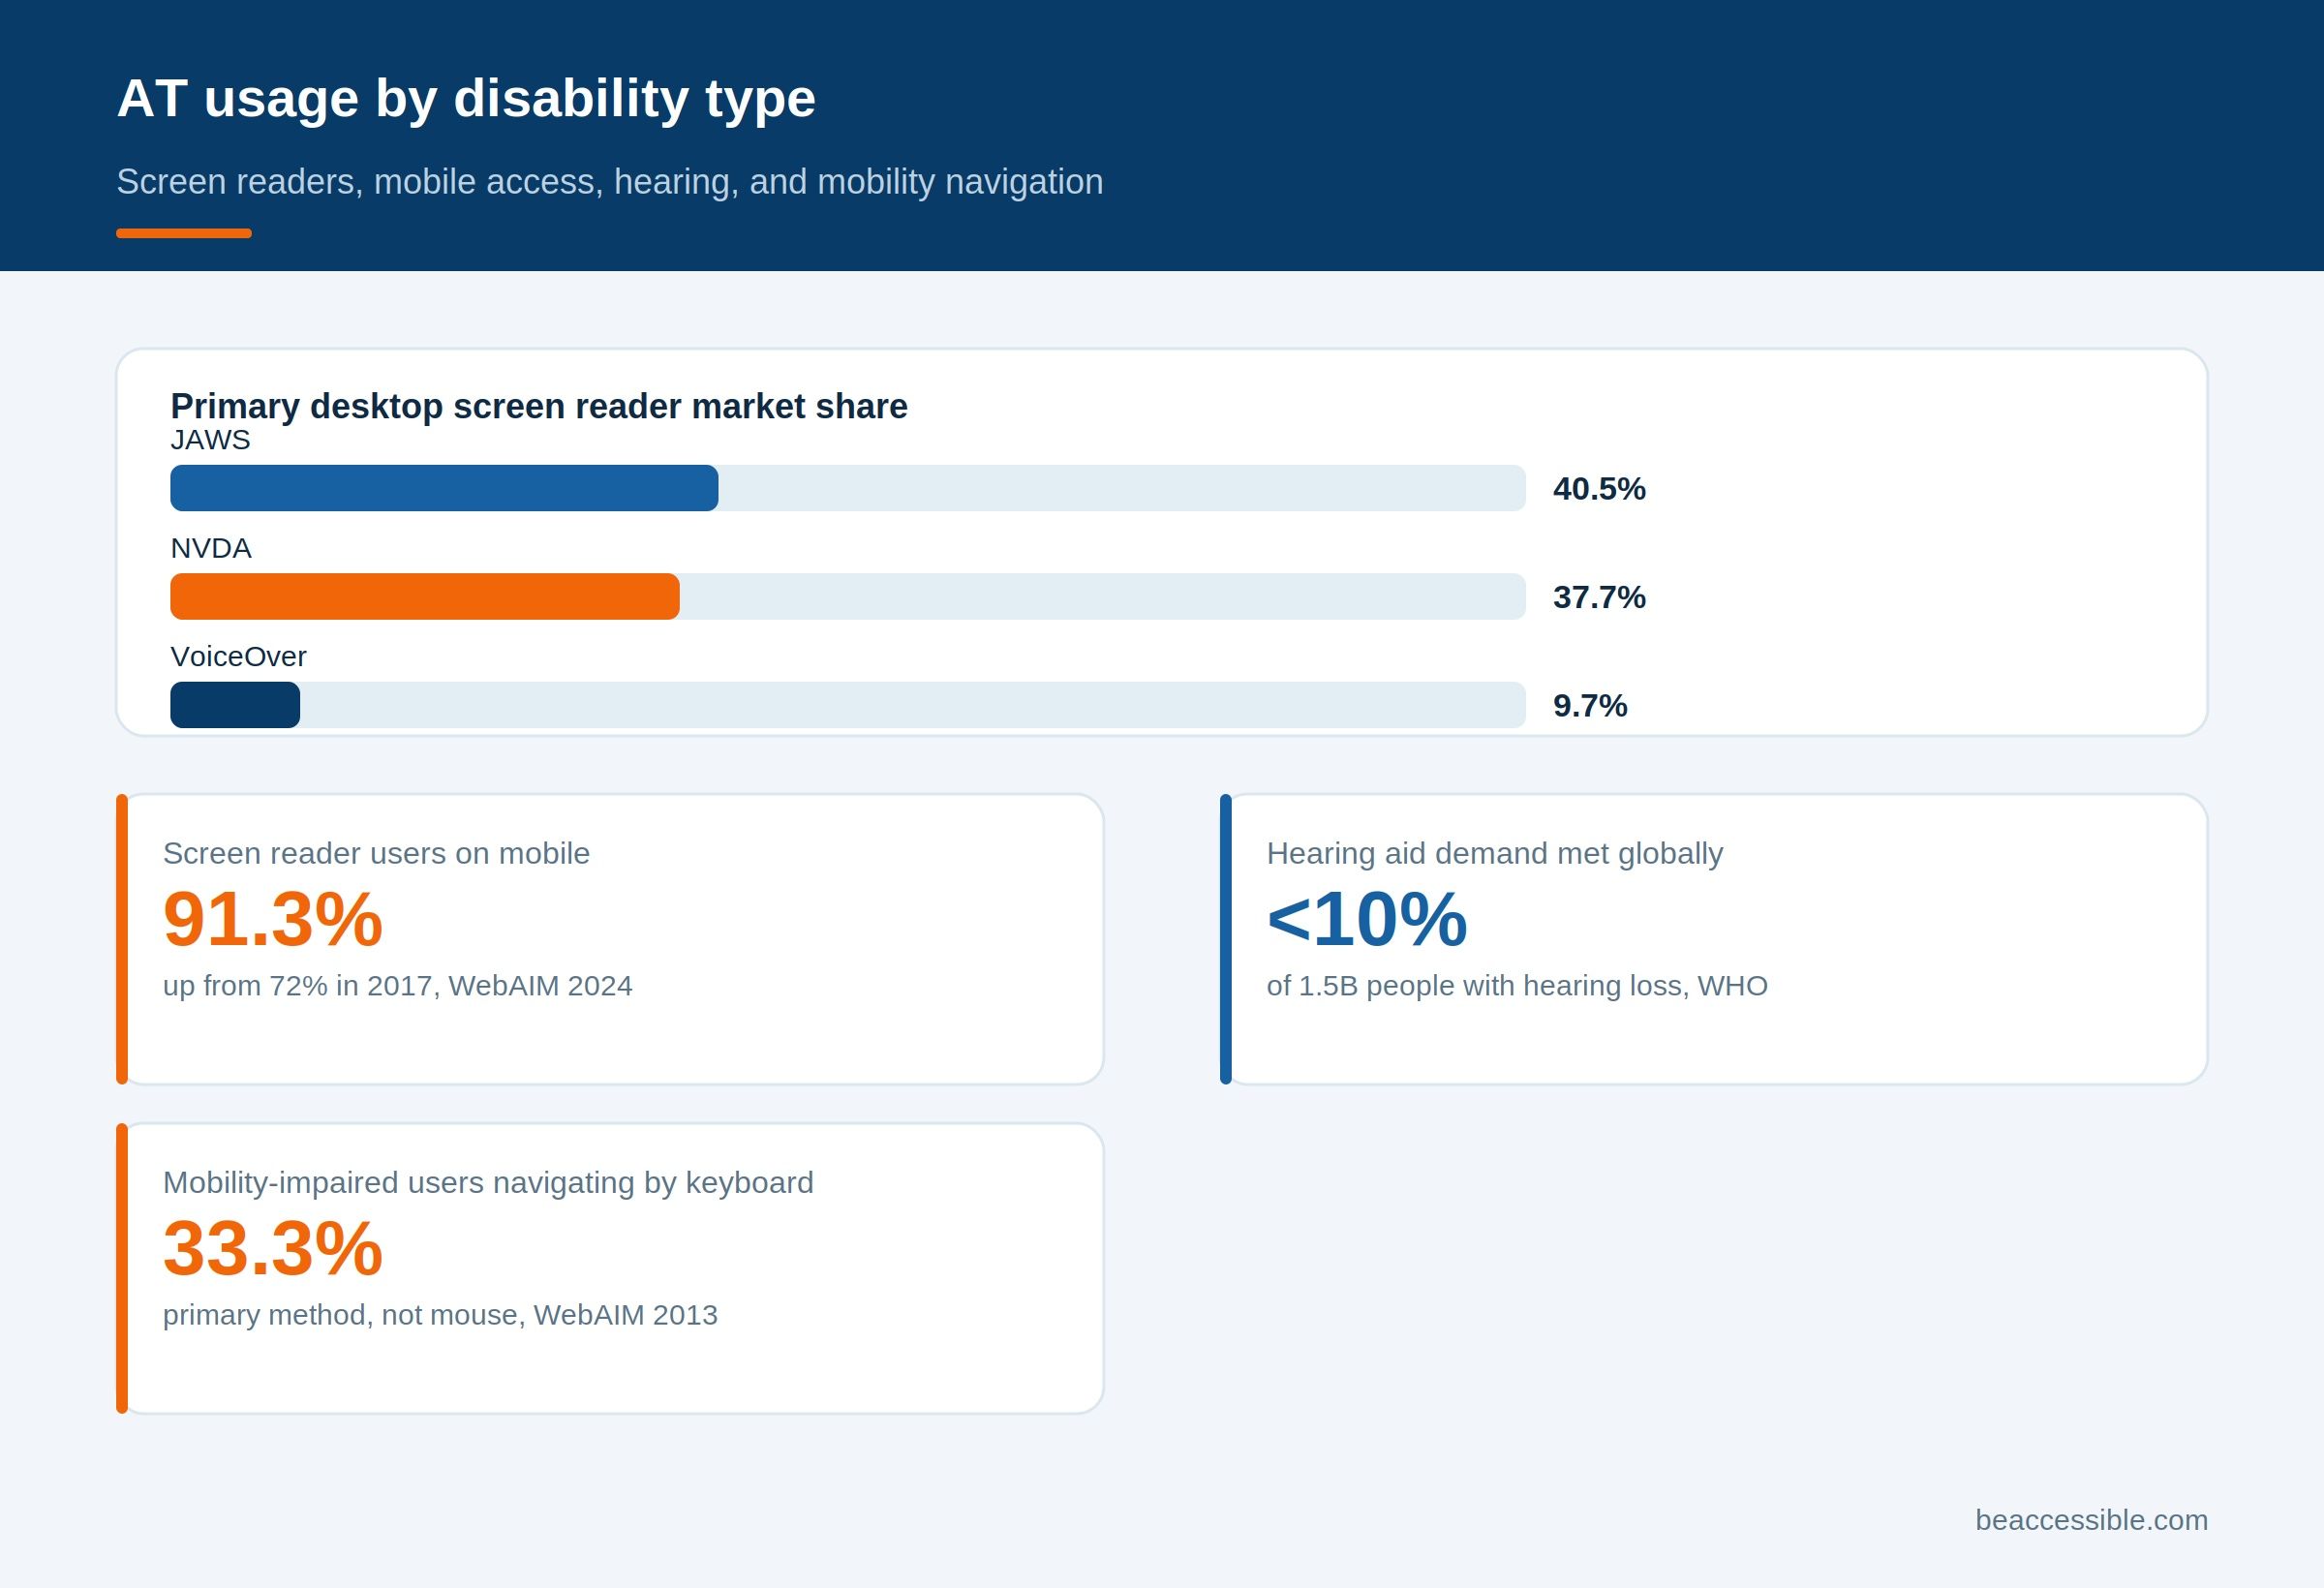
- JAWS is used as the primary desktop screen reader by 40.5% of respondents, with NVDA close behind at 37.7% and VoiceOver at 9.7%. (WebAIM Screen Reader User Survey #10, 2024)
- 91.3% of screen reader users access the web on a mobile device, up from 72% in 2017, showing how quickly mobile AT adoption has accelerated. (WebAIM Screen Reader User Survey #10, 2024)
- Hearing aid production currently meets less than 10% of global demand, despite an estimated 1.5 billion people worldwide living with some degree of hearing loss. (World Health Organization, Assistive Technology fact sheet)
- 33.3% of people with mobility impairments use a keyboard or keyboard-like device as their primary means of web navigation, relying on switch controls, adapted keyboards, or voice recognition rather than a mouse. (WebAIM, Survey of Users with Motor Disabilities, 2013)
Assistive Technology Market Size
Market data confirms what usage statistics already suggest: demand for assistive technology, and particularly for digital and software-based AT, is expanding steadily rather than plateauing.
Global AT Market Size and Growth
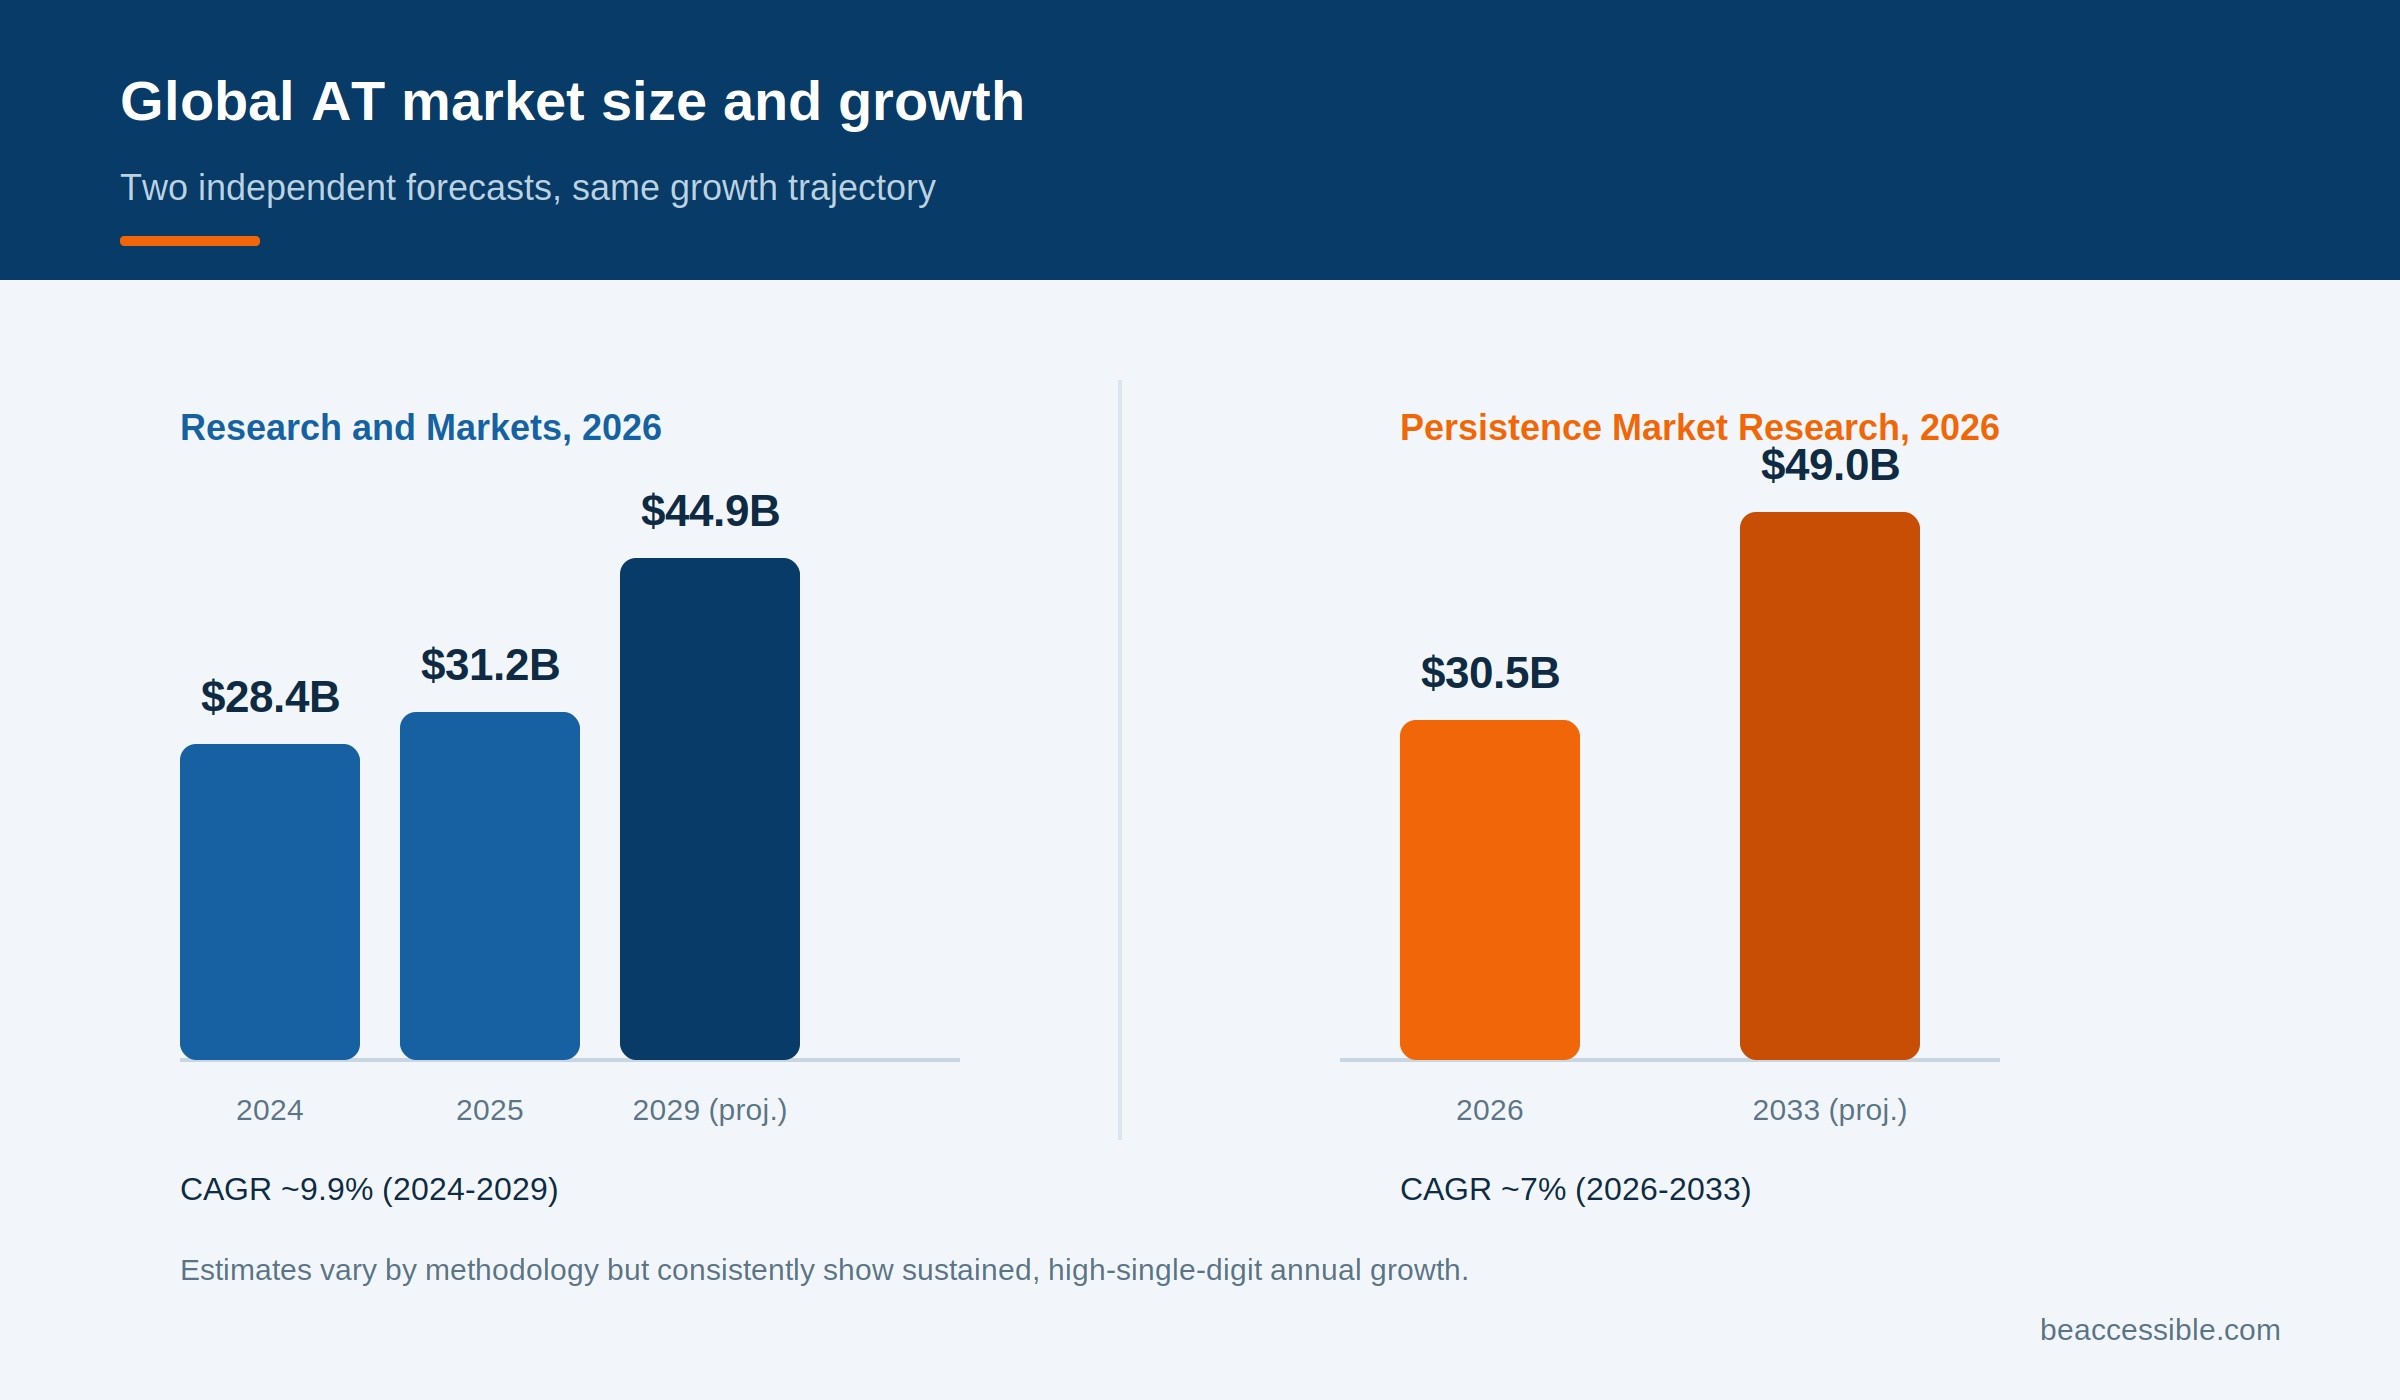
- The global assistive technology market was valued at approximately $22.9 billion in 2023 and is projected to grow at a compound annual rate of 4.8% through 2033. (Market.us, Assistive Technology Market Report, 2024)
- The market is expected to reach approximately $36.6 billion by 2033, roughly 60% larger than its 2023 size, driven by an aging population and increased government support for accessibility. (Market.us, Assistive Technology Market Report, 2024)
- Independent market research places the 2024 valuation slightly higher, at around $26.8 billion, growing to $41.0 billion by 2033, underscoring that estimates vary by methodology but consistently point to sustained mid-single-digit annual growth. (IMARC Group, Assistive Technology Market Report)
AT Market by Segment
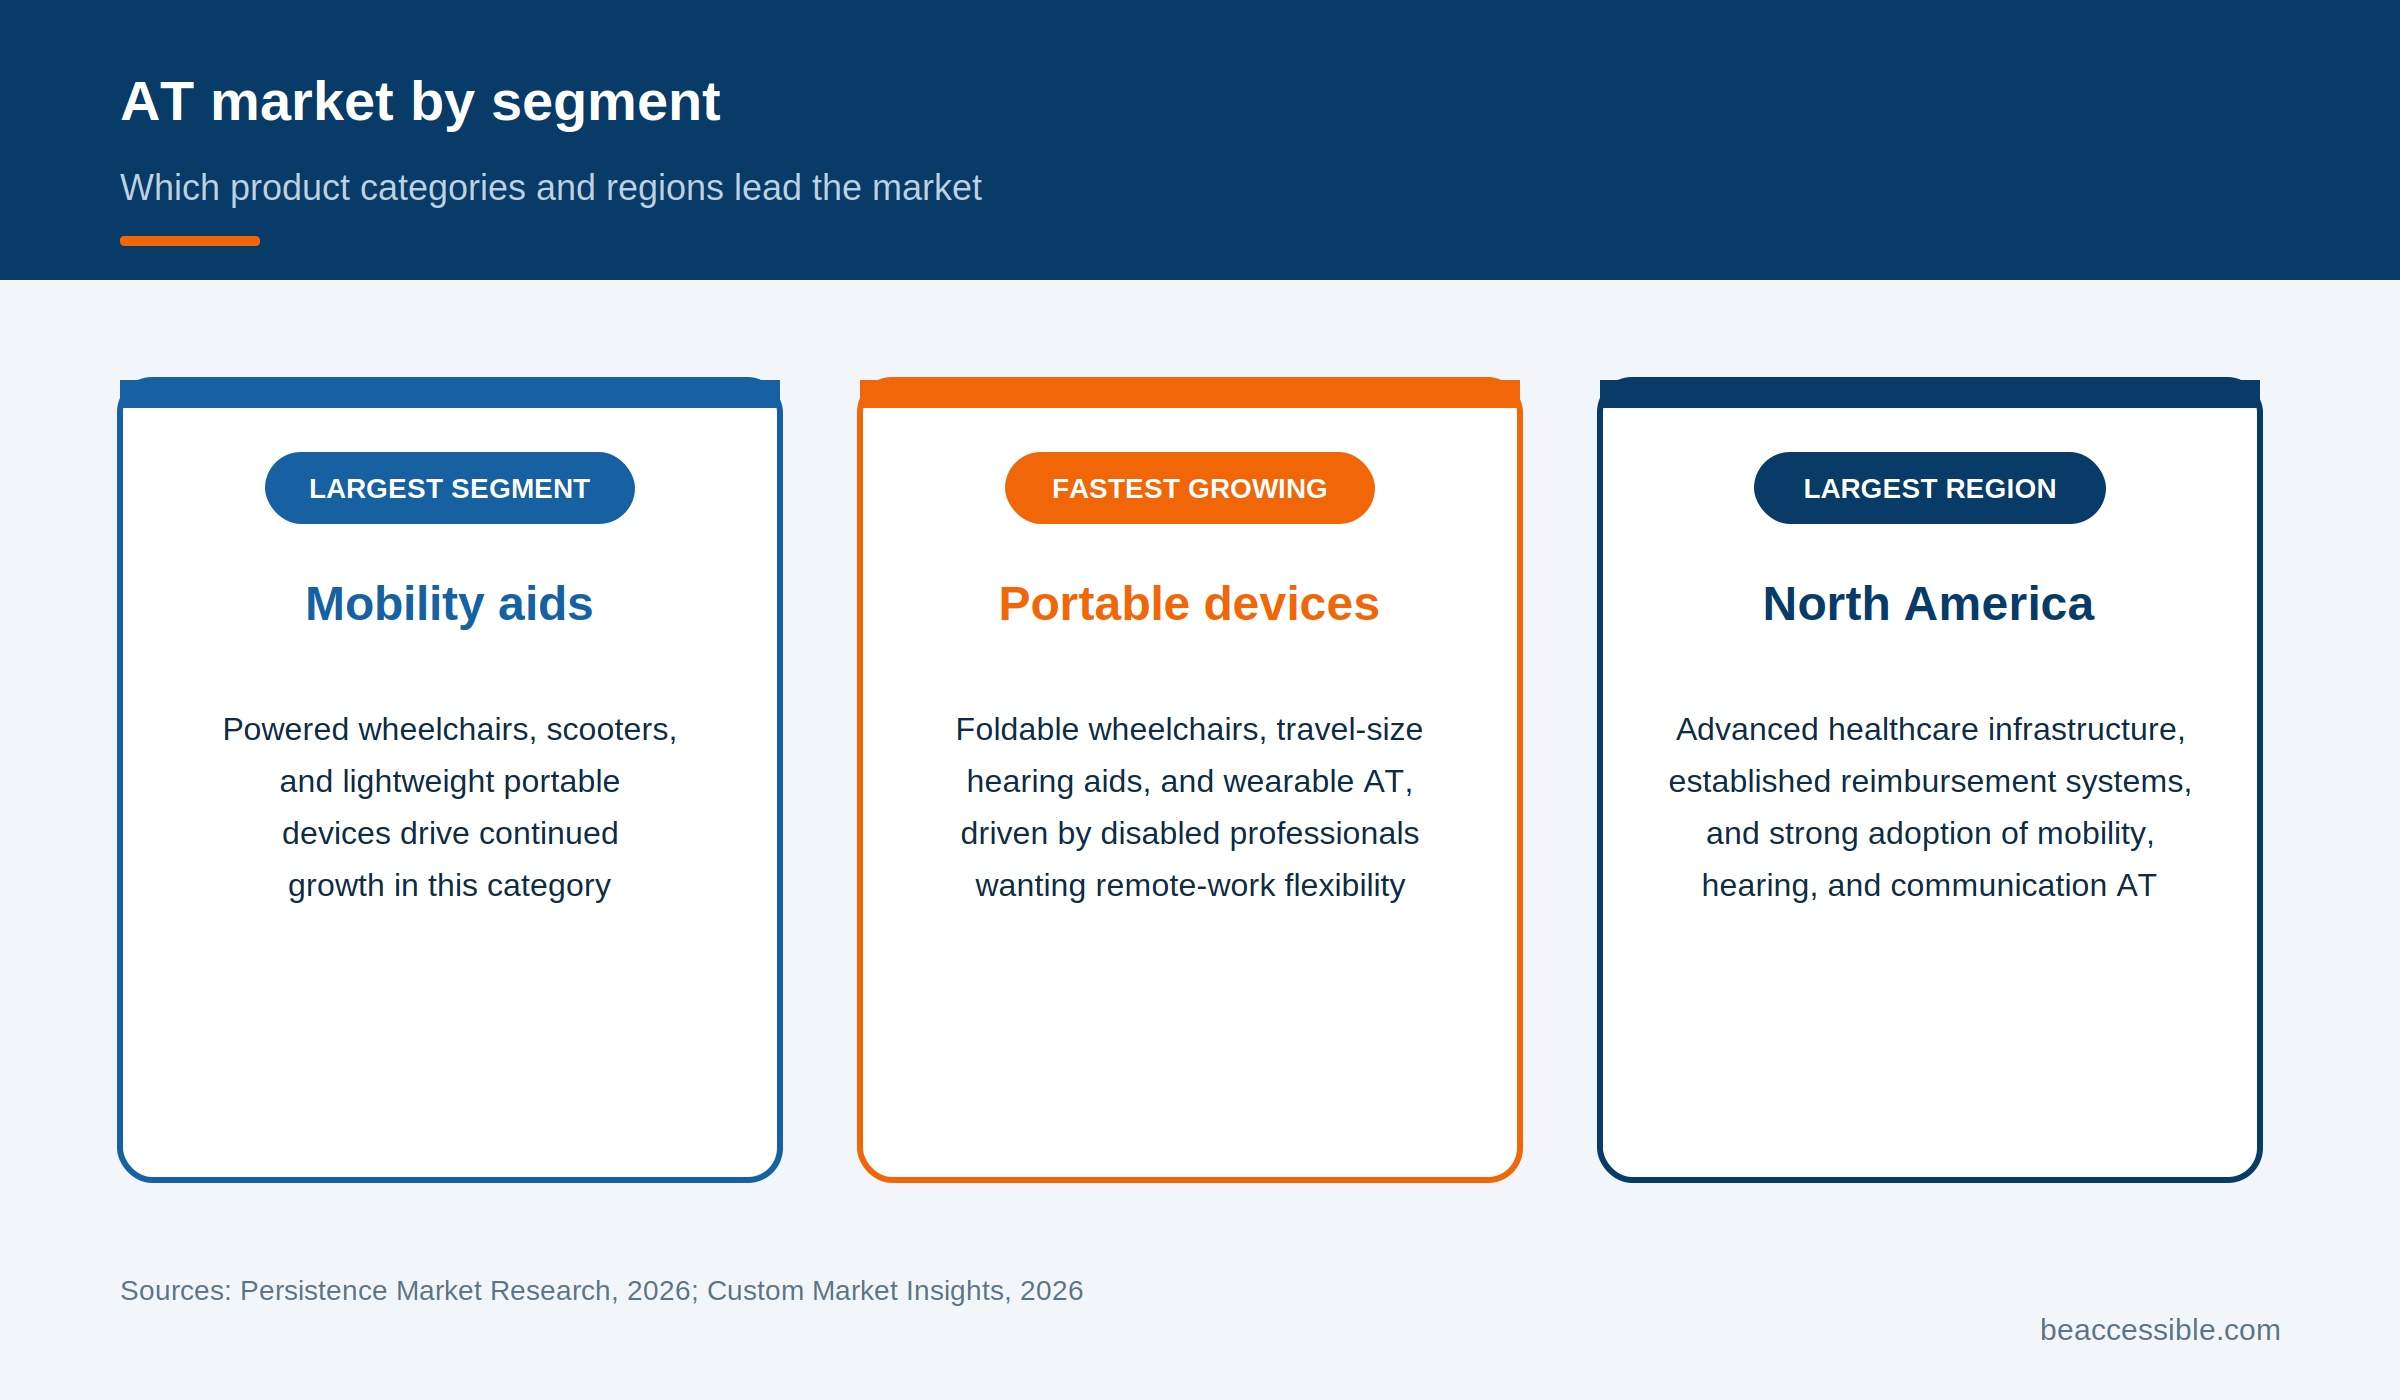
- Mobility aids represent the largest product segment in the assistive technology market, capturing more than 35% of total market share. (Market.us, Assistive Technology Market Report, 2024)
- Hospitals and clinics account for more than 27% of the market by end-user setting, ahead of home care and other distribution channels. (Market.us, Assistive Technology Market Report, 2024)
- Online retailers now capture more than 33% of assistive product sales, reflecting a broader shift away from specialty medical suppliers as the primary purchase channel. (Market.us, Assistive Technology Market Report, 2024)
Digital and Software AT Market
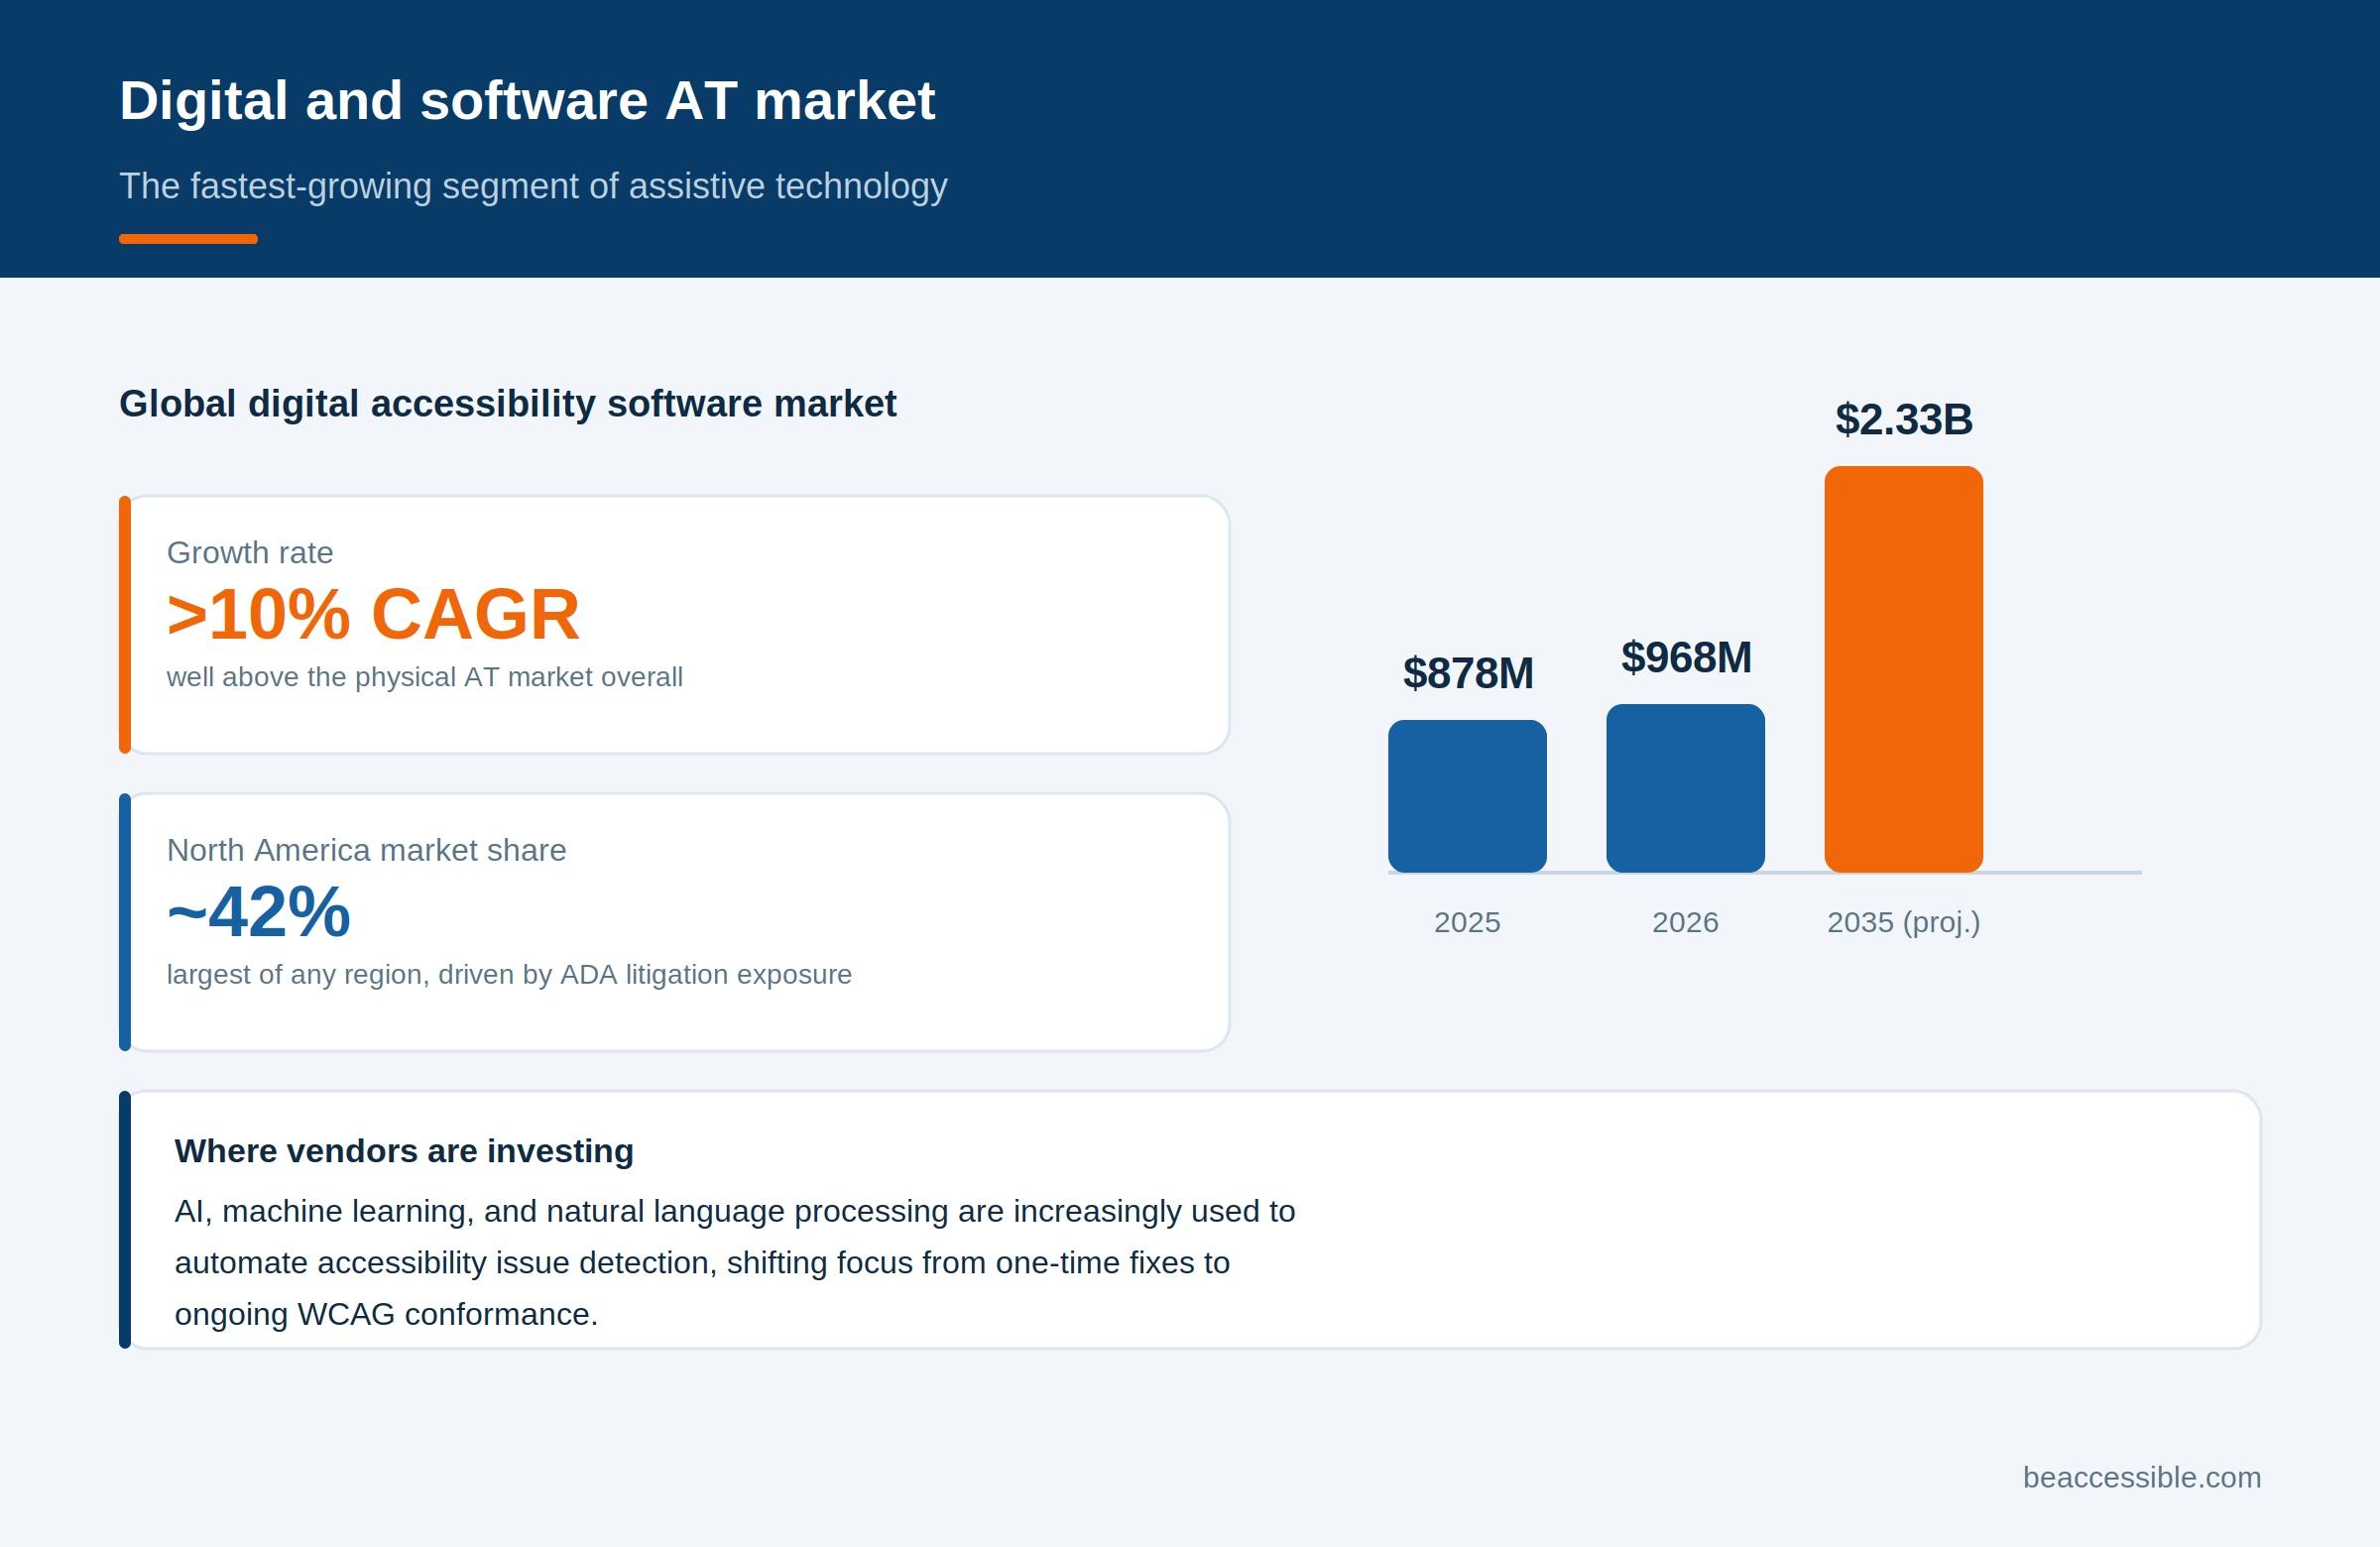
- Digital accessibility software is growing twice as fast as the assistive technology market overall: the global market was worth $721.1 million in 2023 and is projected to hit $1.30 billion by 2030, a 9.2% CAGR. (Grand View Research, Digital Accessibility Software Market Report, 2024)
- North America holds more than 43.6% of the digital accessibility software market, the highest regional share of any segment discussed in this report. (Grand View Research, Digital Accessibility Software Market Report, 2024)
- Vendors are building AI, machine learning, and natural language processing directly into accessibility software to automate issue detection, shifting organizations from one-time remediation to ongoing WCAG conformance. (Grand View Research, Digital Accessibility Software Market Report, 2024)
Assistive Technology and Web Accessibility
Every category of assistive technology depends on the same underlying requirement: correctly structured, standards-compliant code. When a site fails basic WCAG criteria, the result is rarely a minor inconvenience. For AT users, it can mean the page is unusable.
Screen Readers and Digital Access
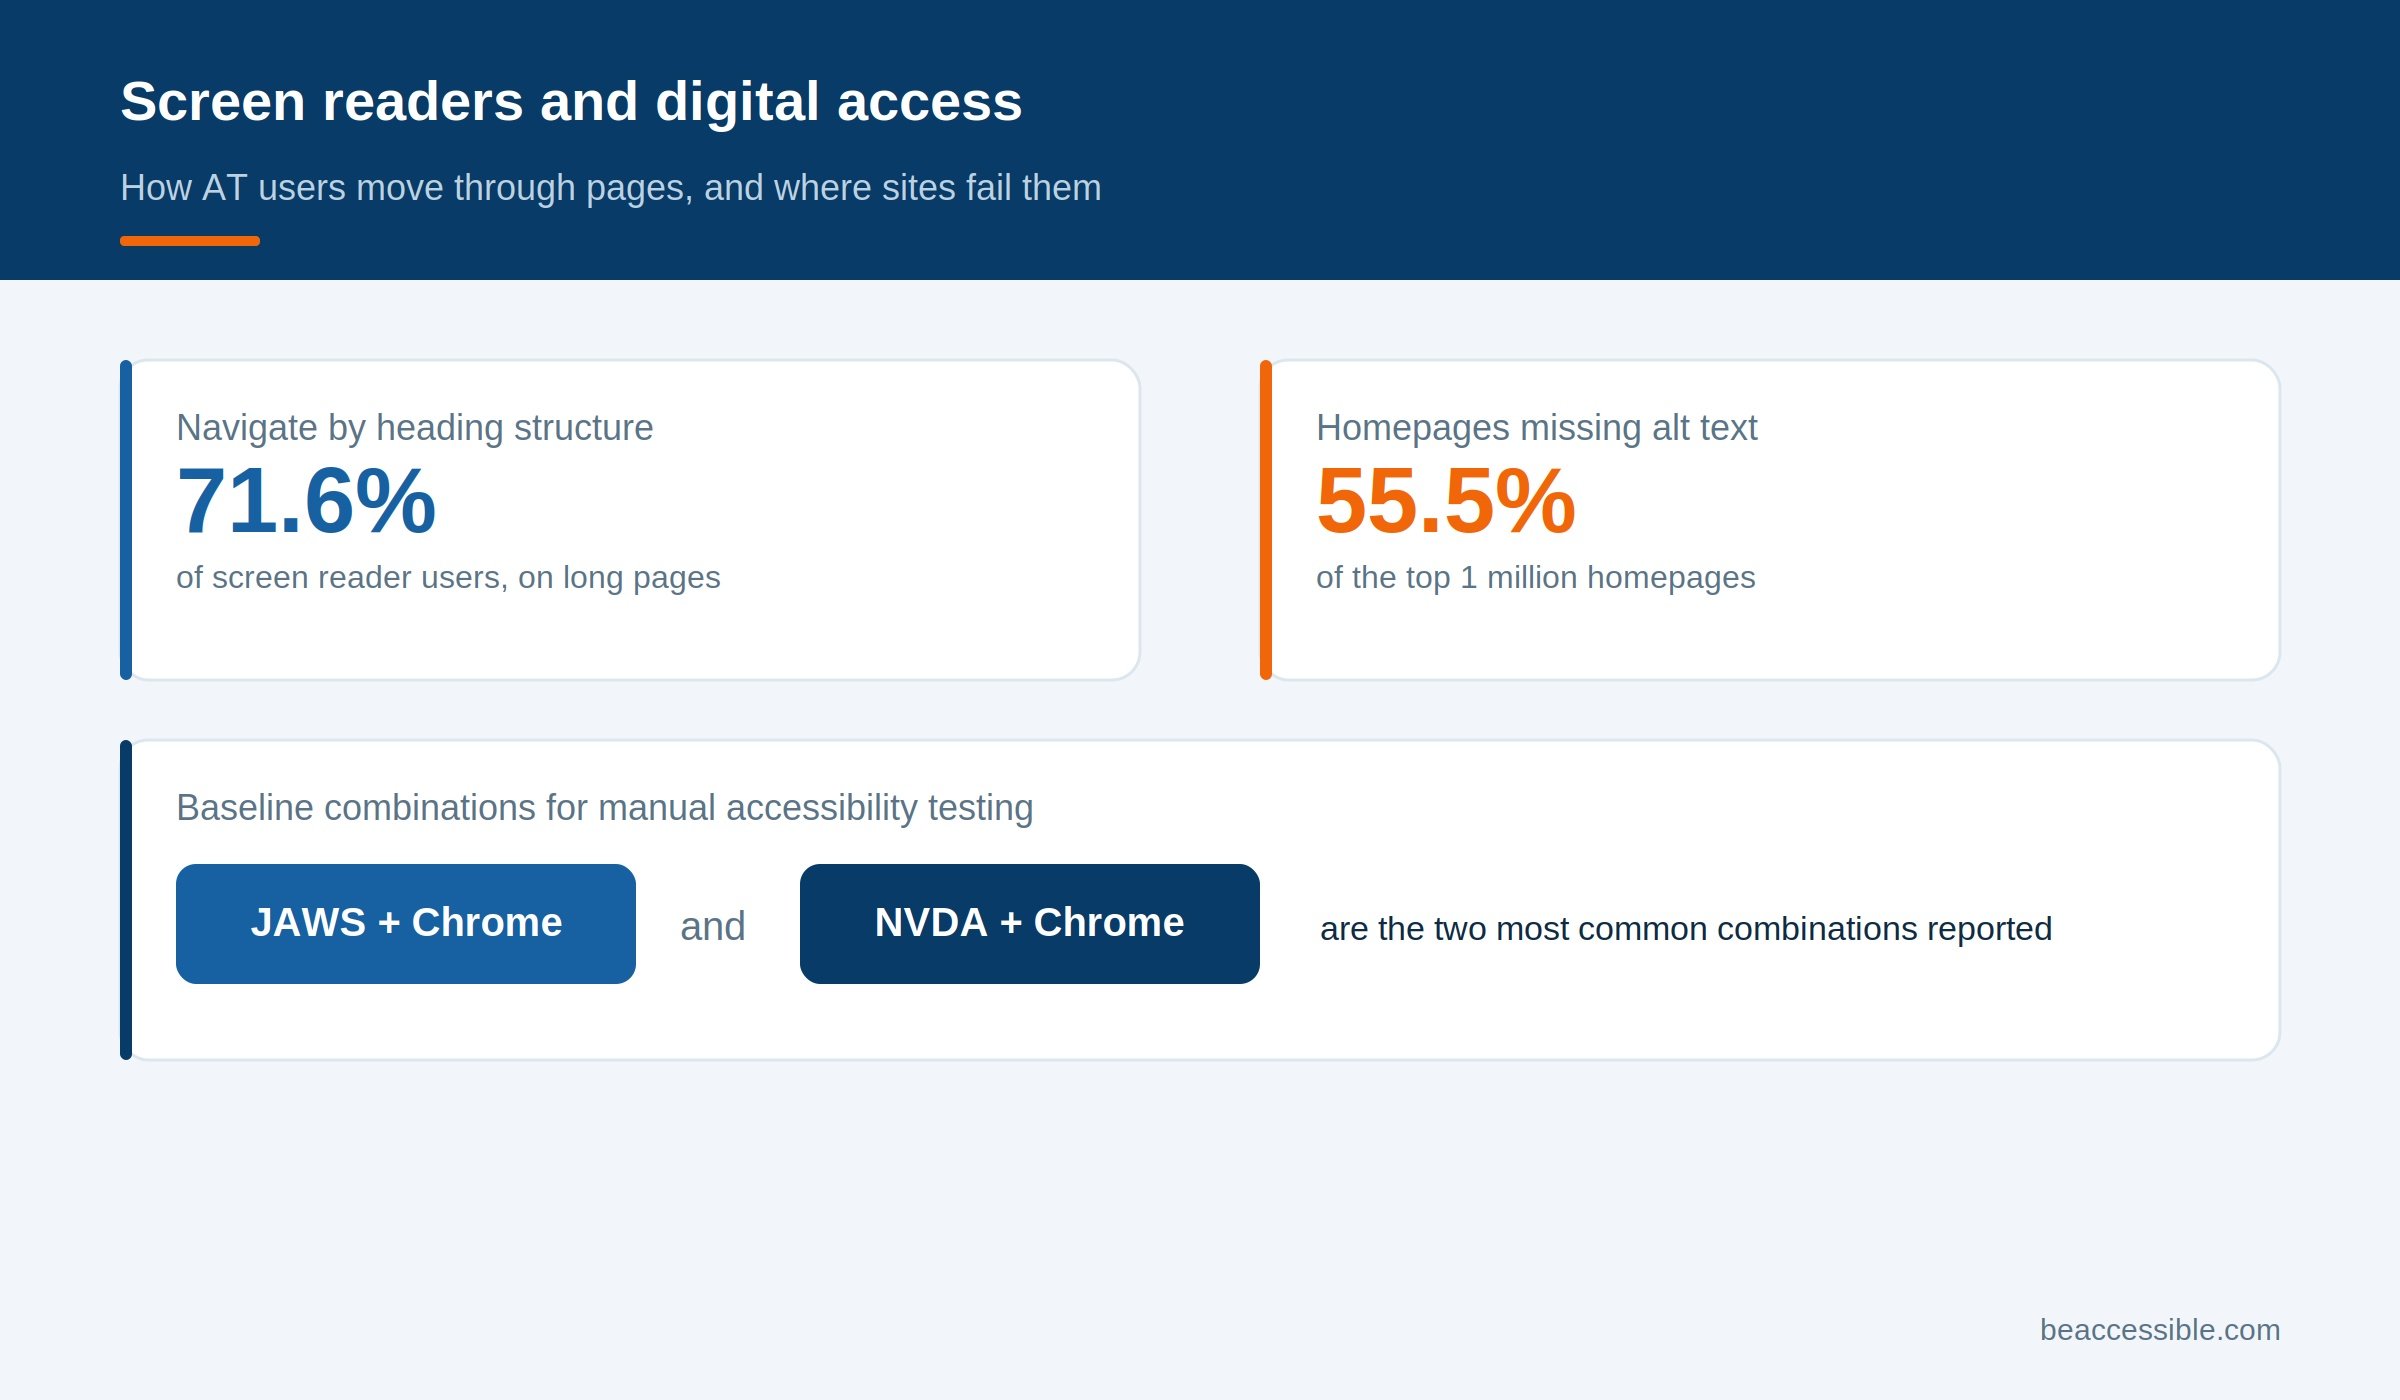
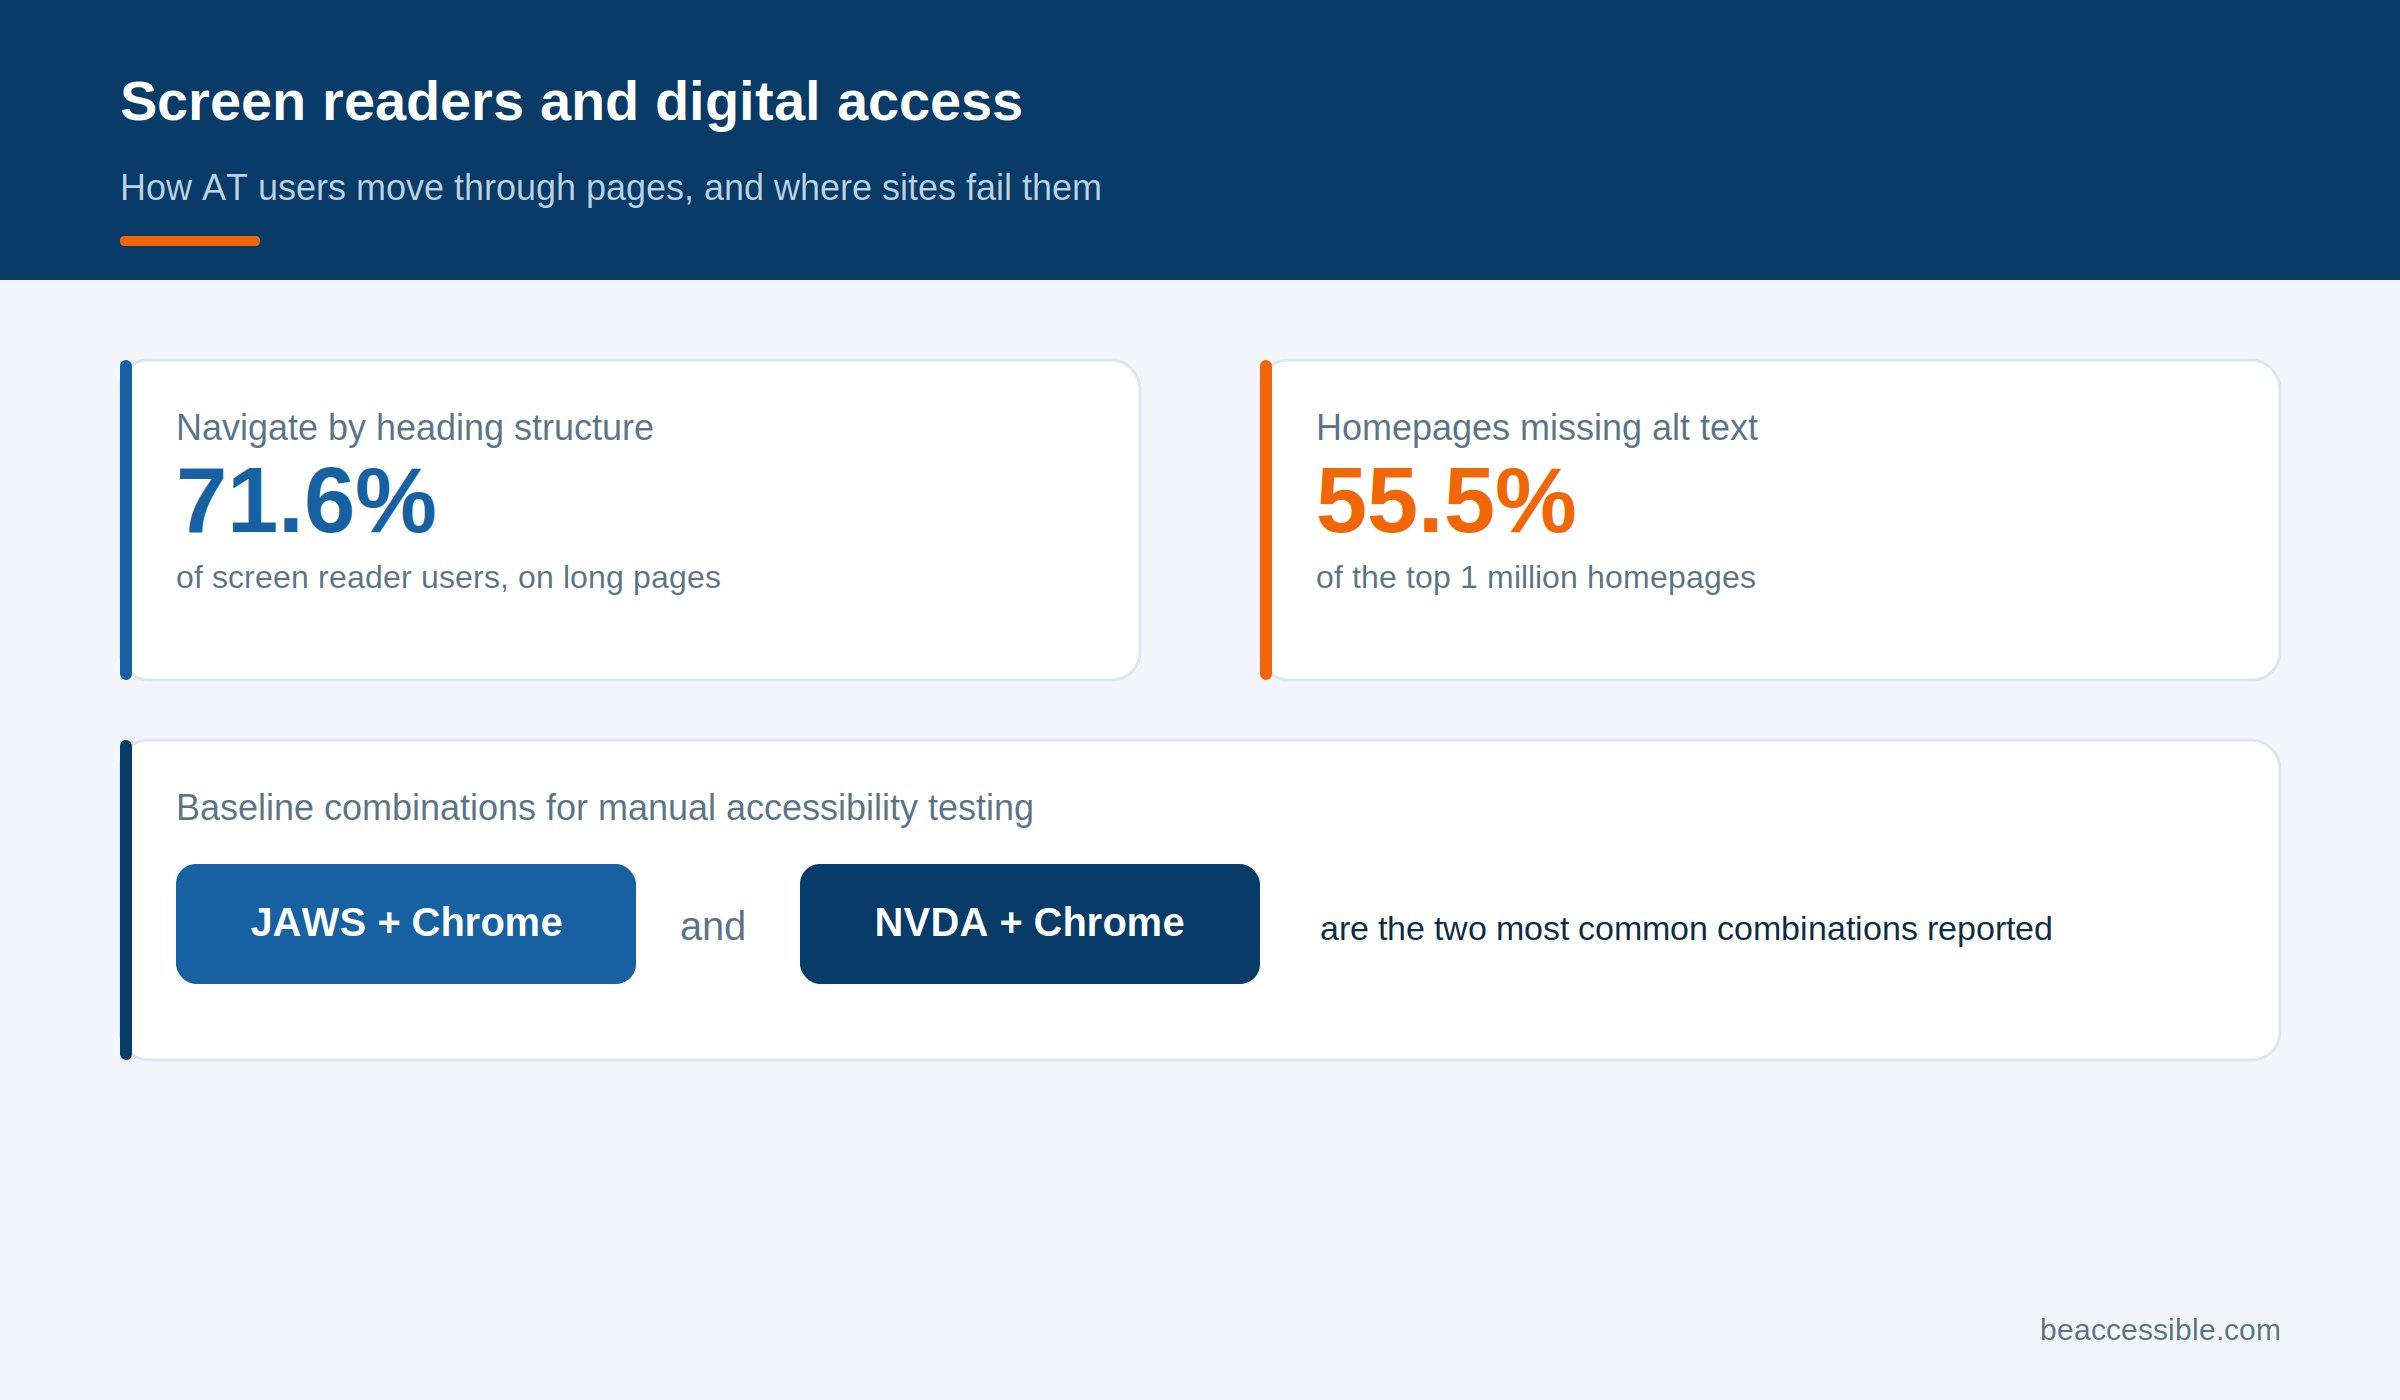
- 71.6% of screen reader users navigate long web pages primarily by heading structure, making correct heading hierarchy one of the highest-impact fixes on any page. (WebAIM Screen Reader User Survey #10, 2024)
- 55.5% of the top one million homepages are missing alternative text for images, directly blocking screen reader users from understanding image-based content. (WebAIM Million, 2025)
- JAWS with Chrome and NVDA with Chrome are the two most common screen reader and browser combinations, and should form the baseline for manual accessibility testing on any WCAG-focused audit. (WebAIM Screen Reader User Survey #10, 2024)
Captions, Transcripts, and Hearing Accessibility
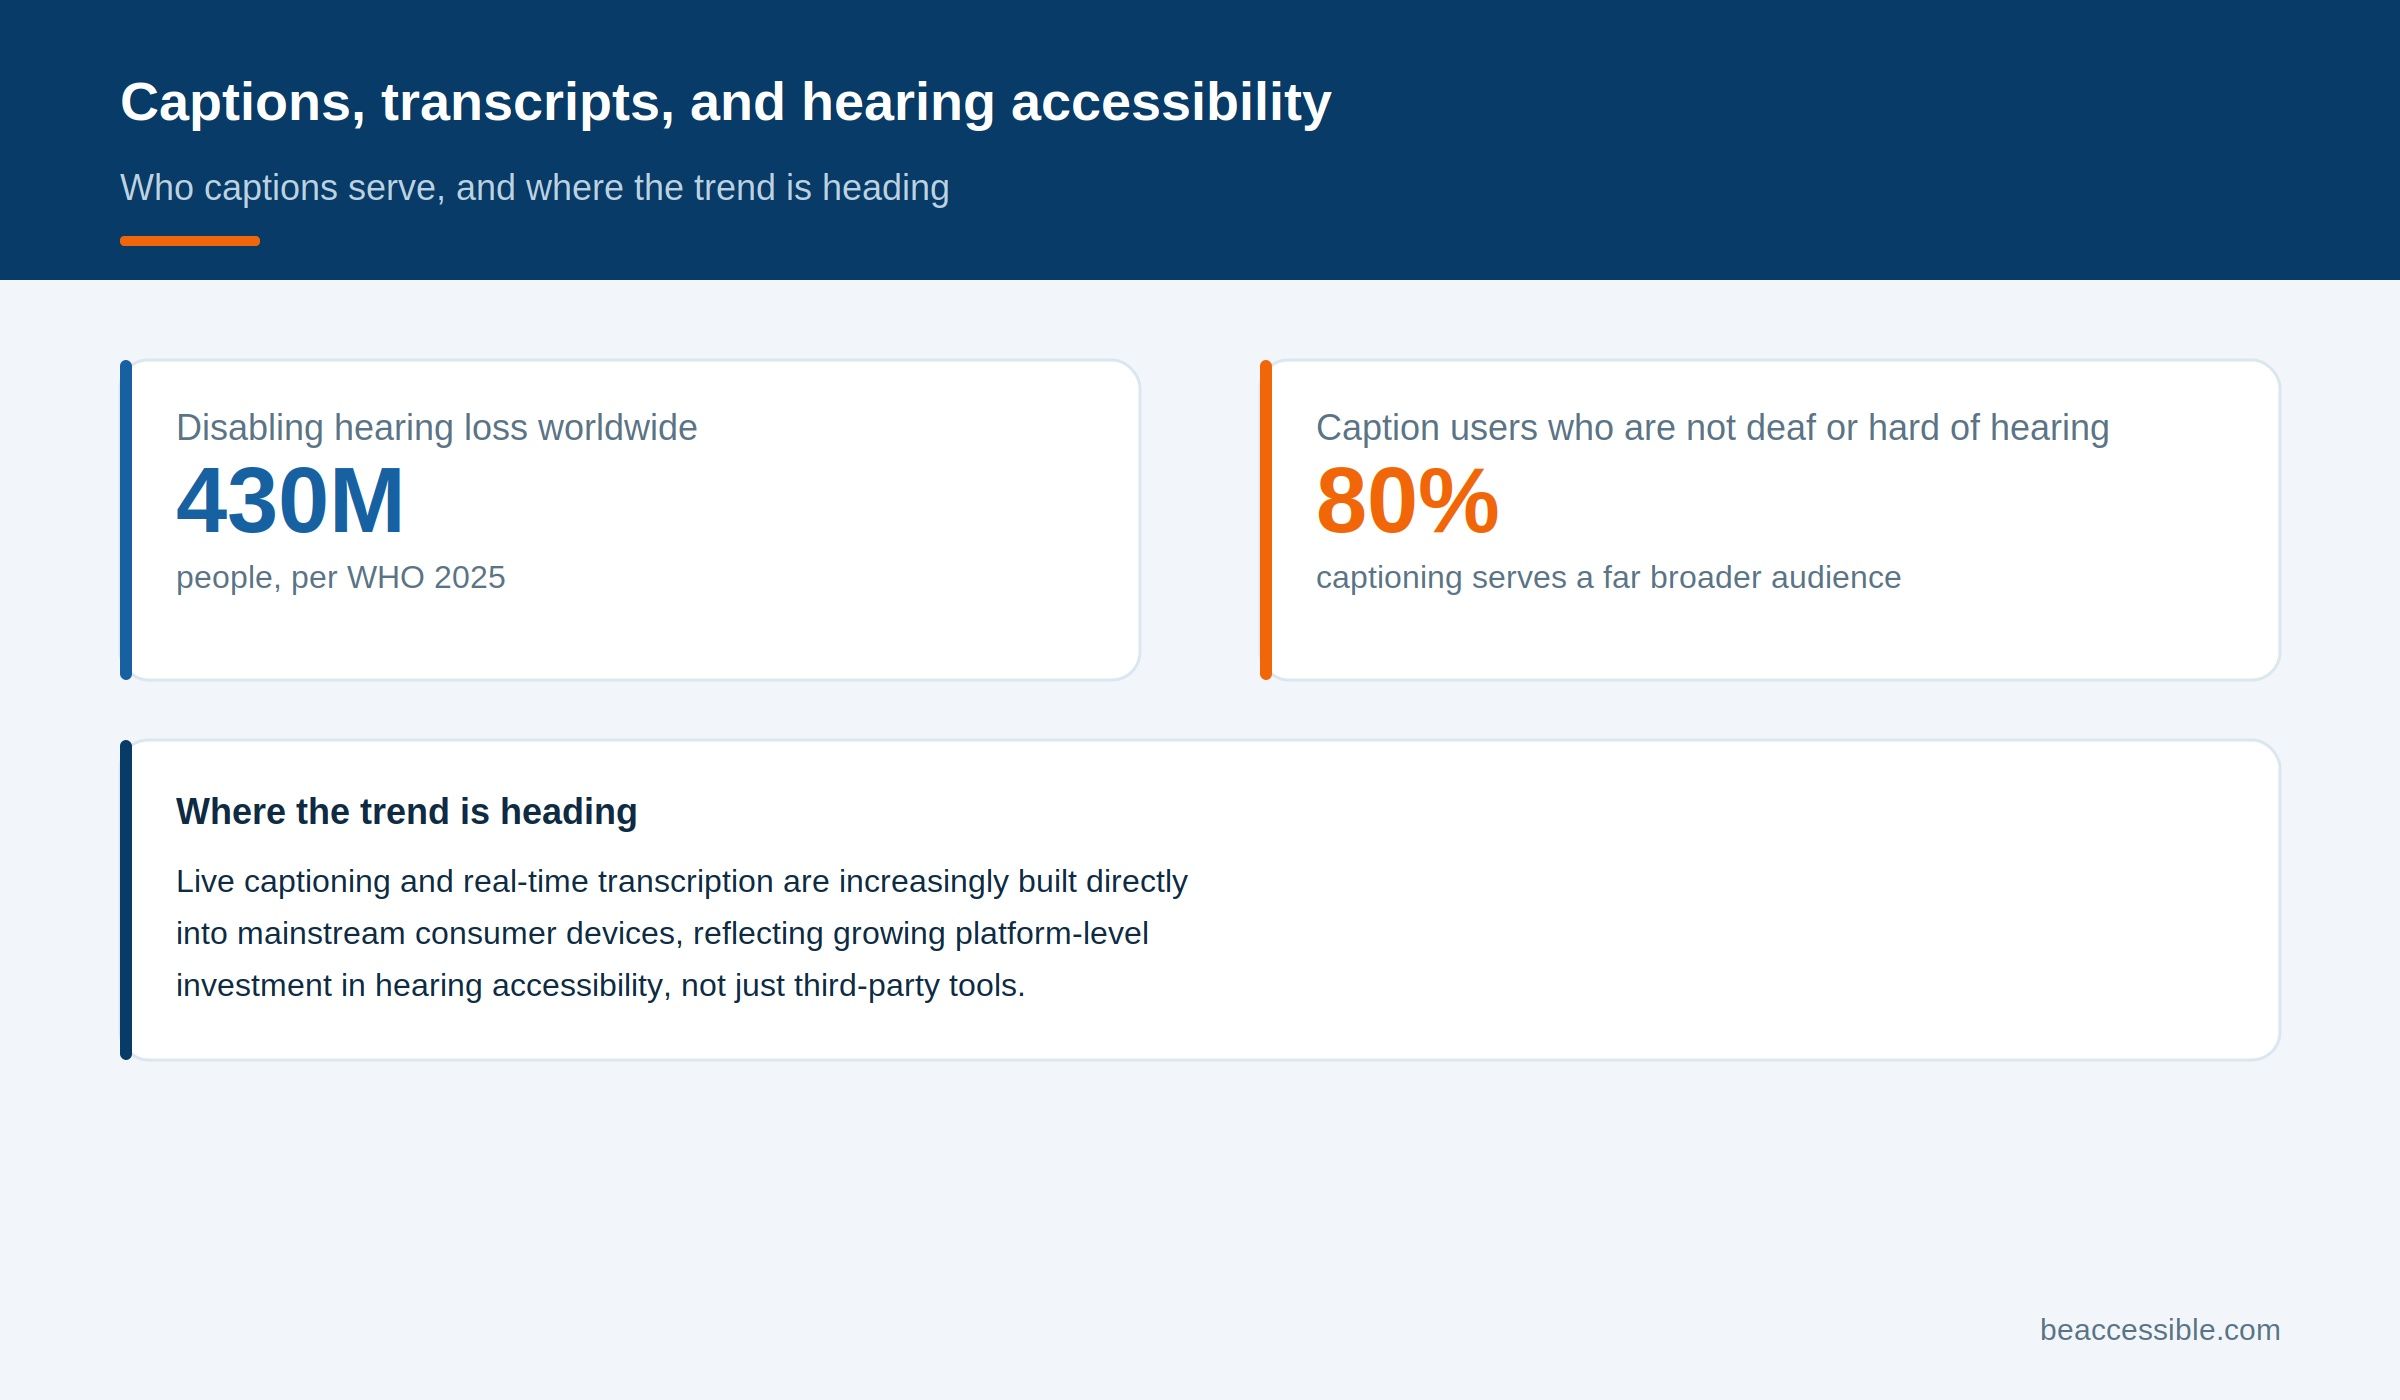
- Approximately 430 million people worldwide experience disabling hearing loss, requiring captions or transcripts to access audio and video web content. (World Health Organization, 2025)
- 80% of UK caption users are not d/Deaf or hard of hearing, one of the clearest signs that captions serve a far bigger audience than the one they were built for. (3Play Media, citing Ofcom research)
- With 430 million people worldwide living with disabling hearing loss, live captioning has moved from a broadcast-only feature to a baseline expectation on phones, video calls, and streaming apps. (World Health Organization, 2025)
Keyboard and Motor Accessibility
- 33.3% of users with mobility impairments rely on a keyboard or keyboard-like device as their primary navigation method, making full keyboard operability a WCAG 2.2 Level A requirement with direct usage impact. (WebAIM, Survey of Users with Motor Disabilities, 2013)
- Only 36% of users with motor disabilities use mobile accessibility settings, compared to 63% of users with low vision, showing that mobile accessibility tooling still lags for this group. (WebAIM, Survey of Users with Motor Disabilities, 2013)
- Roughly two-thirds of web pages (67%) actively remove focus outlines in their CSS, stripping the visual cue keyboard and switch-control users depend on to navigate. (Web Almanac, HTTP Archive, 2025)
Assistive Technology Adoption Barriers
Even where assistive technology exists, adoption is far from universal. Cost is a persistent barrier: roughly two-thirds of assistive product users report paying out of pocket, and specialized software or devices can be prohibitively expensive without insurance or public funding support. Awareness gaps compound the problem, since many people who could benefit from AT are never informed that a relevant tool exists.
Compatibility is the barrier most relevant to web teams: even users who have the right assistive technology in hand are blocked when the websites and applications they need to use were not built to support it. A wheelchair does not help someone complete a form that traps keyboard focus, and a screen reader cannot interpret an image with no alternative text. Closing this last gap, the compatibility between AT and the digital products people actually need to use, is squarely within the control of the businesses that build and maintain those products.
Conclusion
Assistive technology usage statistics point to a population that’s large, growing, and increasingly reliant on digital tools rather than physical devices alone. Billions of people worldwide need some form of assistive product, over 70 million of them in the United States alone, and the fastest-growing segment of the market is software built to support access to digital content.
For any organization managing a public-facing website, these numbers are a reminder that AT compatibility is not a fringe consideration: it determines whether a meaningful share of potential customers, employees, or constituents can use the site at all. A professional website accessibility audit is the most reliable way to confirm your site works with the screen readers, accessible keyboards, and other assistive technologies your visitors actually rely on.
References
- World Health Organization. Assistive Technology fact sheet. https://www.who.int/news-room/fact-sheets/detail/assistive-technology
- CDC, Behavioral Risk Factor Surveillance System, Adult Disability Data Release, 2024. https://www.cdc.gov/media/releases/2024/s0716-Adult-disability.html
- U.S. Department of Health and Human Services, ASPE. Updated Analyses of Trends in the Use of Assistive Devices. https://aspe.hhs.gov/reports/updated-analyses-trends-use-assistive-devices-1
- WebAIM Screen Reader User Survey #10, 2024. https://webaim.org/projects/screenreadersurvey10/
- WebAIM, Survey of Users with Motor Disabilities, 2013. https://webaim.org/projects/motordisabilitysurvey/
- WebAIM Million Report, 2025. https://webaim.org/projects/million/
- Market.us, Assistive Technology Market Report, 2024. https://market.us/report/assistive-technology-market/
- IMARC Group, Assistive Technology Market Report. https://www.imarcgroup.com/assistive-technology-market
- Grand View Research, Digital Accessibility Software Market Report, 2024. https://www.grandviewresearch.com/industry-analysis/digital-accessibility-software-market-report
- World Health Organization, Deafness and Hearing Loss fact sheet, 2025. https://www.who.int/news-room/fact-sheets/detail/deafness-and-hearing-loss

Contact Us
Please complete all fields.
Recent Posts

Website Accessibility for Auditory Disabilities
Deafness and hearing loss affect how people access content delivered through sound, but the experience varies. Someone in the Deaf community may communicate primarily in American Sign Language, a distinct language with its own grammar, not a signed version of English. Someone who is hard of hearing may rely more […]
Website Accessibility for Motor Disabilities
Motor disabilities affect a person’s ability to control or coordinate physical movement, and they take many forms, including limited mobility, tremor, paralysis, and reduced use of one hand or side of the body. These conditions can be present from birth or result from injury, illness, or age-related changes. What they […]

21st Century Communications and Video Accessibility Act (CVAA)
The 21st Century Communications and Video Accessibility Act, signed into law on October 8, 2010, updates federal communications law to ensure people with disabilities have equal access to modern communications technologies and video programming. Unlike the ADA, which is enforced by the Department of Justice, the CVAA is enforced by […]